
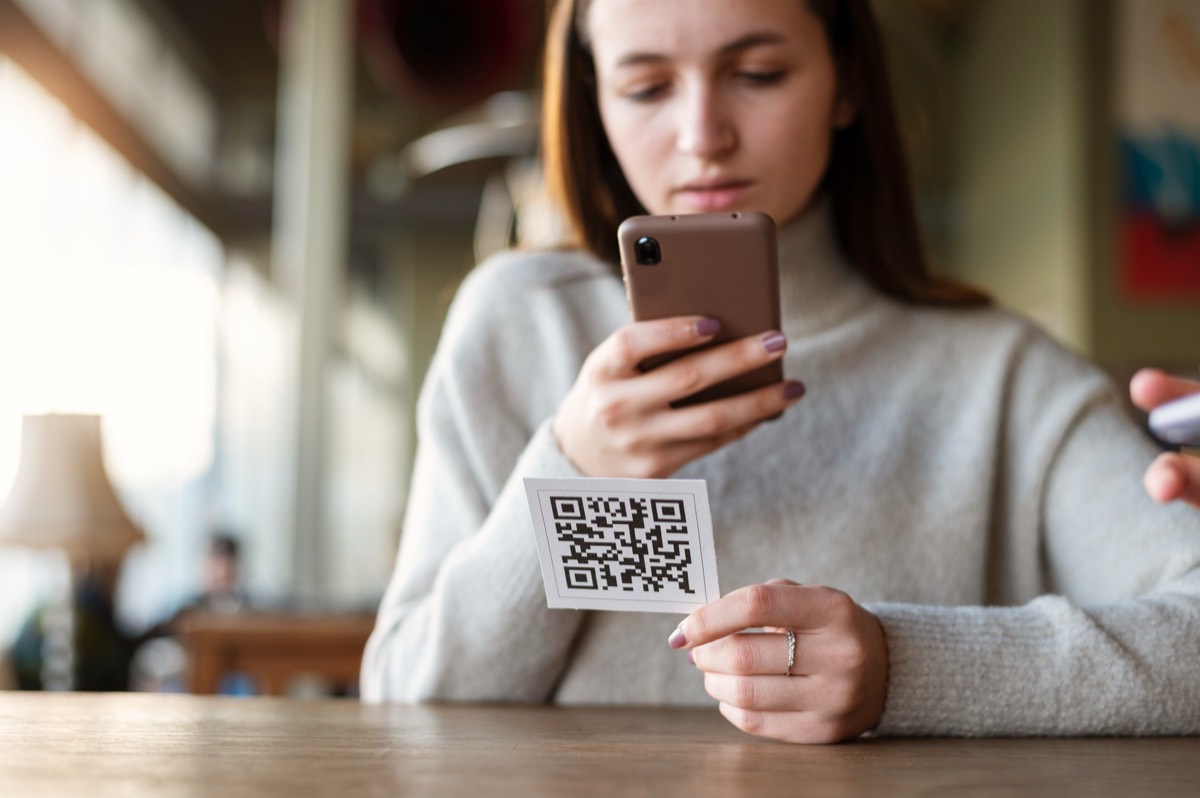
- 94% of marketers surveyed by Bitly in 2025 had increased their QR code use in the previous 12 months, and 86% planned to increase it again.
- Dynamic QR codes held about 65% of the QR code market in 2024 (Mordor Intelligence), because they can be tracked and re-pointed.
- The most-quoted global figures (2.2 billion users, a trillion scans) are forecasts, not measurements. Treat them accordingly.
Most QR code statistics on the web are copied from one another, and several of the biggest numbers are forecasts from 2021 that have been restated as 2025 or 2026 facts. This page keeps only figures with a traceable source and says what each one measures.
How many marketers use QR codes?
Bitly surveyed marketers for its 2025 QR code statistics report (published November 2025). The adoption figures:
| Statistic | Figure | Source |
|---|---|---|
| Marketers who increased QR code use in the past 12 months | 94% | Bitly, 2025 |
| Marketers planning to increase use in the next 12 months | 86% | Bitly, 2025 |
| Market share held by dynamic (trackable, editable) codes in 2024 | 65% | Mordor Intelligence, 2024, cited by Bitly |
| Forecast growth rate of dynamic codes to 2030 | 19.2% per year | Mordor Intelligence, cited by Bitly |
The dynamic-code share is the number that matters for anyone printing codes: two thirds of the market has moved to codes that go through a redirect, because that is the only way to count scans or change a destination after printing. How that works.
Where marketers put QR codes
From the same Bitly survey, the channels where marketers use QR codes:
| Channel | Share of marketers |
|---|---|
| 47% | |
| Product packaging | 46% |
| Events | 43% |
| Print advertising | 40% |
| In-store displays | 40% |
And what the codes link to:
| Destination | Share of marketers |
|---|---|
| Promotional offers or coupons | 51% |
| Event information or registration | 49% |
| Product details or specifications | 45% |
How consumers scan
Consumer-side figures, as cited in the Bitly report (years as stated by the original surveys):
| Statistic | Figure | Source |
|---|---|---|
| Consumers who used a QR code at least once in the last year | over two thirds | TEAM LEWIS survey (year not stated) |
| Gen Z and Millennials who scan at least weekly | about half | TEAM LEWIS survey |
| Shoppers who scanned a product QR code in a store | 64% | 1WorldSync, 2024 Consumer Product Content Benchmark |
| Shoppers who scanned a product code after purchase | 61% | 1WorldSync, 2024 |
| Consumers more likely to buy a product with a scannable code | 79% | GS1 Pulse Survey, 2024 |
Why consumers scan, from the TEAM LEWIS survey:
| Reason | Share |
|---|---|
| Restaurant menus | 48% |
| Mobile apps | 47% |
| Product information | 43% |
| Wi-Fi access | 32% |
| Event tickets | 31% |
Restaurant menus leading the list is consistent with the QR payment market, where Grand View Research put restaurants at a 28% revenue share in 2024 (cited by Bitly). If you run a venue, the QR menu guide covers how to set one up so it can be updated and measured.
The US scanner count
Statista, citing eMarketer (forecast published December 2022), projected that the number of US smartphone users scanning a QR code would pass roughly 100 million in 2025, up from the high 80 millions in 2022. This is a forecast made before 2025, so it should be quoted as "eMarketer projected", not as a count.
What marketers measure, and what they struggle with
Bitly's 2025 survey also asked which QR code metrics marketers value most:
| Metric | Share who value it |
|---|---|
| Unique users | 54% |
| Conversion rate after the scan | 52% |
| Total scans | 50% |
| Scan time and date patterns | 50% |
And 87% named understanding the post-scan customer journey as their top challenge in proving return on investment.
Three of the four valued metrics (unique users, total scans, time patterns) come straight out of a scan log, which is why a trackable code matters. The fourth, conversion, needs the destination page to carry a UTM parameter or its own analytics. How to track QR code scans explains both.
Numbers you will see elsewhere, and why they are not here
- "2.2 billion QR code users": a Juniper Research forecast from 2021 for QR code payment users in 2025, up from 1.5 billion in 2020. It is about payments, mostly in Asia, and it was a projection. It is often misquoted as the number of people who scan codes.
- "Over a trillion scans in 2025": widely repeated, with no primary source that we could find.
- Platform scan totals (tens or hundreds of millions of scans per year from individual QR code vendors): real, but each only counts that vendor's own customers. They say more about the vendor than the market.
- "QR code use grew 57%": appears with different years attached depending on the site. Without a stable source and date it is not usable.
Get your own numbers instead
Industry statistics tell you QR codes are worth using. They cannot tell you whether the code on your flyer is being scanned. For that you need a dynamic code with a scan log: country, city, time and device per scan, and a destination you can change after printing. QList does this for free, without a scan limit. See what gets recorded, or go straight to pricing, which is a short page.
Sources are linked inline. This article is updated when the underlying reports are. Last checked: 8 October 2026.
Frequently asked questions
How many people scan QR codes?
There is no measured global count. The most-cited figure, 2.2 billion, is a 2021 Juniper Research forecast for QR code payment users in 2025. In the US, eMarketer forecast around 100 million smartphone users scanning a QR code in 2025. Platform operators report their own totals, which only cover their customers.
Are QR codes still growing in 2026?
Among marketers, yes: in Bitly's 2025 survey, 94% had increased usage in the previous year and 86% planned to increase it further. On the consumer side, surveys cited by Bitly put the share of people who scanned at least one code in the past year at over two thirds.
What are QR codes used for most?
Marketers put them on email (47%), product packaging (46%), events (43%), print ads (40%) and in-store displays (40%). Consumers scan most often for restaurant menus (48%), mobile apps (47%) and product information (43%).